Index
In our original Coffee analysis, one question was especially uncomfortable for marketers: if AI mentions competitors in our category, should we panic?
Building on that question, the broad food analysis in “What does 33% search Drop in Chinese Food Really Means?” gave us a more specific hypothesis to investigate. With six Asian cuisines appearing in the Top 10 representative cuisine queries, we asked whether Korean and Japanese food discovery showed a cultural chain reaction. Could entertainment, media, and cultural exposure become meaningful entry points into category search?
To be clear, this is not a test of whether culture caused total demand. The data cannot support that claim. Instead, we traced whether a cultural perspective appeared in the search journey, whether it became a Category Entry Point, whether AI retrieved a marketer’s brand for that moment, and whether the surrounding category had material query volume.
The question is not whether culture is the answer. It is where the cultural signal appears, and where it stops.
Cultural Signals Appear Inside a Much Larger Demand System
We began with Journey Finder exports for Korean and Japanese food. Both datasets show users moving from broad discovery into more specific behaviors such as brands, menus, reviews, locations, reservations, ordering, and cooking. The stage distribution below comes directly from the two shared exports.
| CDJ stage | Korean keywords | Korean volume | Japanese keywords | Japanese volume |
| Initial Exploration | 4,556 | 4,310,577 | 3,938 | 146,935,439* |
| Browsing | 409 | 2,151,548 | 752 | 1,558,334 |
| Experience | 48 | 4,473 | 108 | 8,133 |
| Confirmation | 53 | 725,407 | 83 | 29,969 |
| Own & Service | 25 | 767 | 21 | 15,055 |
The Japanese Initial Exploration total includes the generic query “restaurant near me” at 133,000,000 monthly searches. It should not be used as a direct category size comparison with the Korean dataset.
For Korean food, Initial Exploration contained 4,556 keywords and 4,310,577 in monthly volume. In addition, Browsing added another 409 keywords and 2,151,548 in volume, led heavily by brand and retail terms. Confirmation was concentrated around access questions such as near me, locations, prices, and reservations.
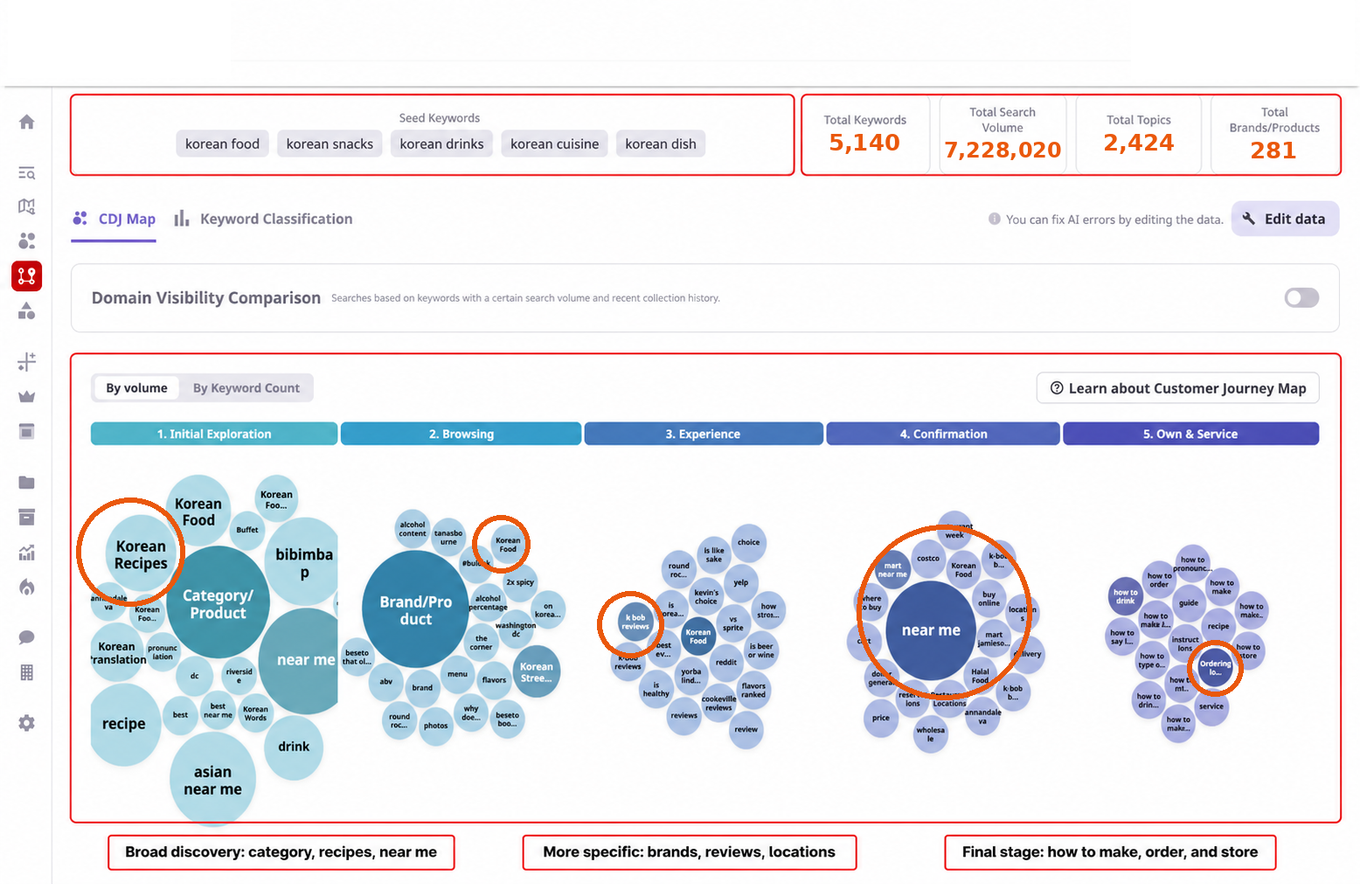
Cultural language was present, including searches such as “korean food mukbang,” “mukbang korean food,” and “k drama food.” In the shared export, 38 unique culture related matches produced 4,422 in combined monthly volume using a simple substring review. That makes the cultural layer visible, but small beside the main category, brand, and location demand. It is a discovery signal, not evidence that culture drives the entire category.
Following the same pattern, the Japanese journey progressed from food, recipes, and near me searches into brands, menus, reviews, reservations, ordering, and cooking. But its total search volume requires a major caveat: the export includes the generic query “restaurant near me” at 133 million monthly searches. The 148.6 million total therefore cannot be compared directly with the Korean total as if it represented Japanese category size.
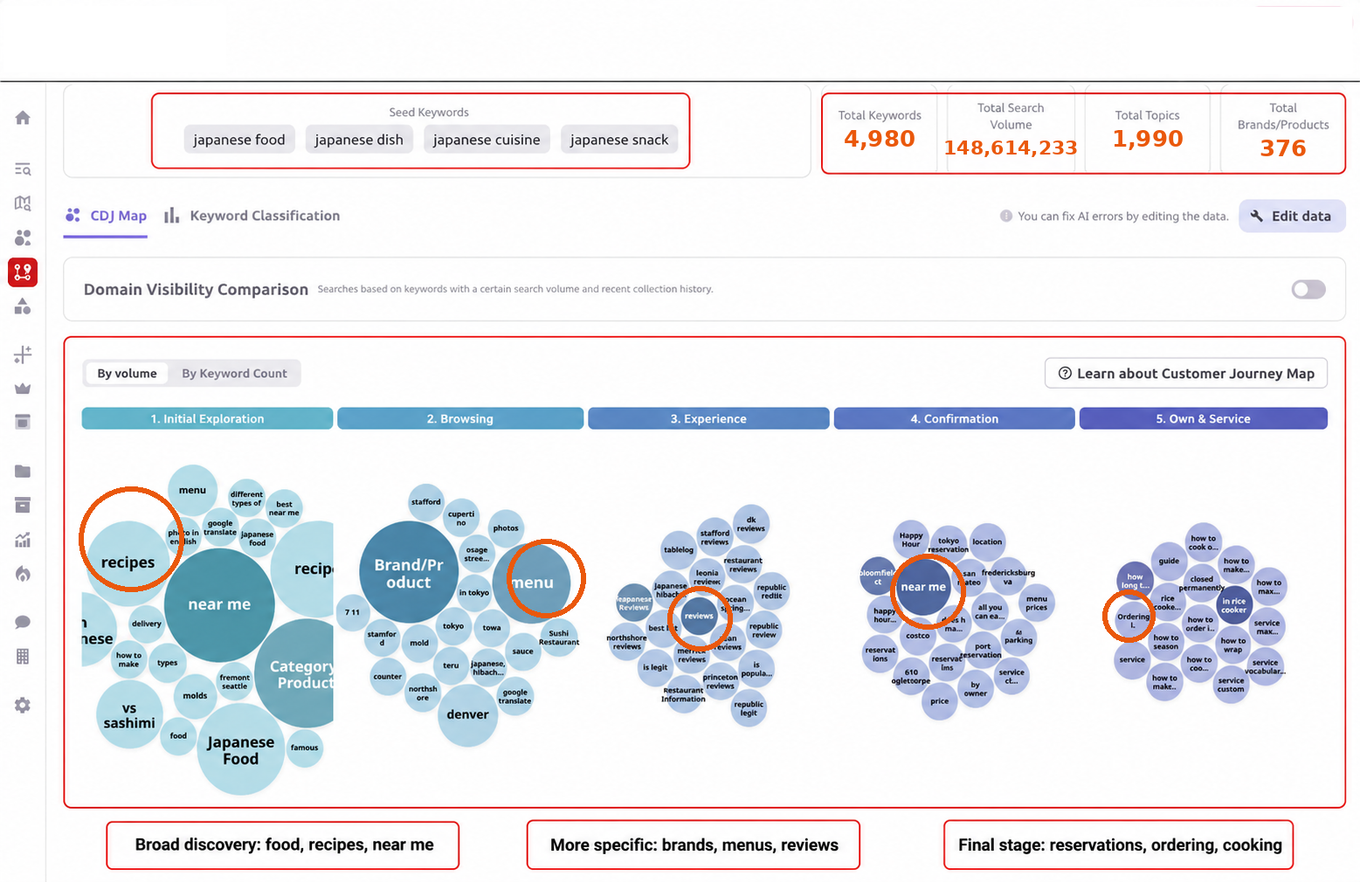
Anime, manga, and Japan culture terms also appeared, but they did not dominate the captured journey. The first finding is therefore asymmetric: a cultural perspective exists in both datasets, while the Korean journey provides the clearer bridge into an explicit media triggered food occasion.
The Same Cultural Hypothesis Does Not Produce the Same Entry Point
Journey data tells us what is connected. CEP Finder reframes those connections as situations in which a person may enter the category. This is where the Korean cultural signal became much more concrete.
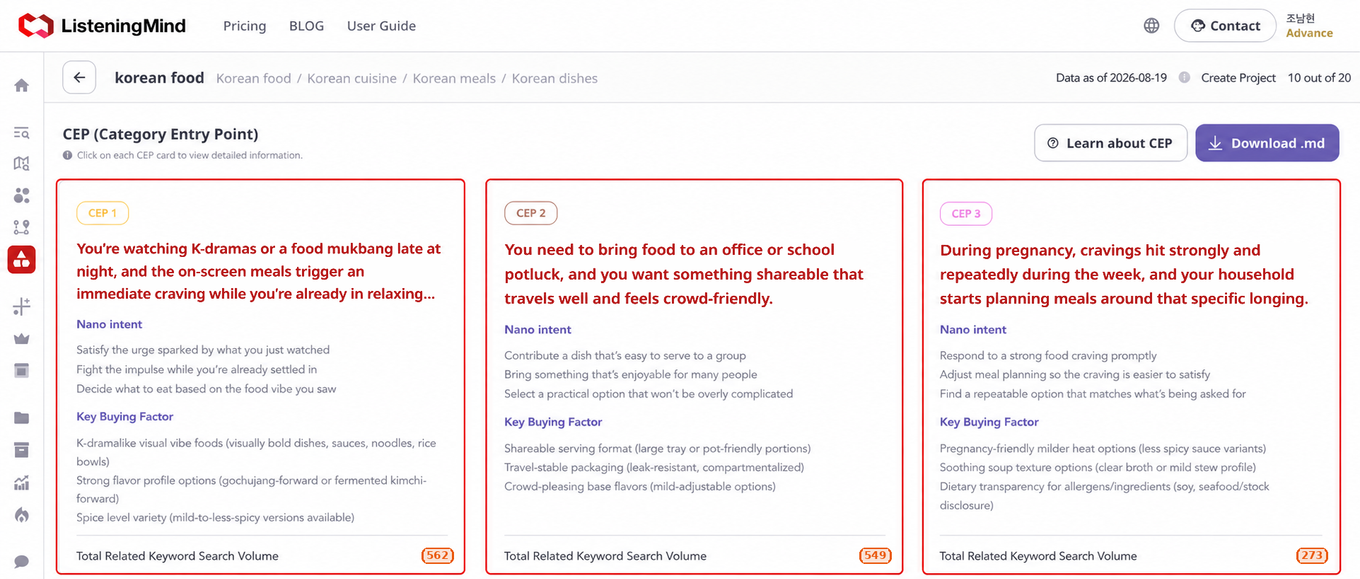
Korean food CEPs include a K-drama or mukbang triggered craving alongside practical meal occasions.
The leading Korean CEP described someone watching K dramas or a food mukbang late at night and experiencing an immediate craving. In the latest AI Optimizer view, this CEP carried 20 related keywords and 550 in total monthly volume. The cultural trigger was therefore discovered as a defined entry context.
By contrast, Japanese food produced a different set of leading entry points. Family dinner, a quick meal after a long day, birthdays, rainy evenings, late night eating, and a gentle meal when sick were more prominent in the captured CEP set. These are everyday consumption situations rather than pop culture led moments.
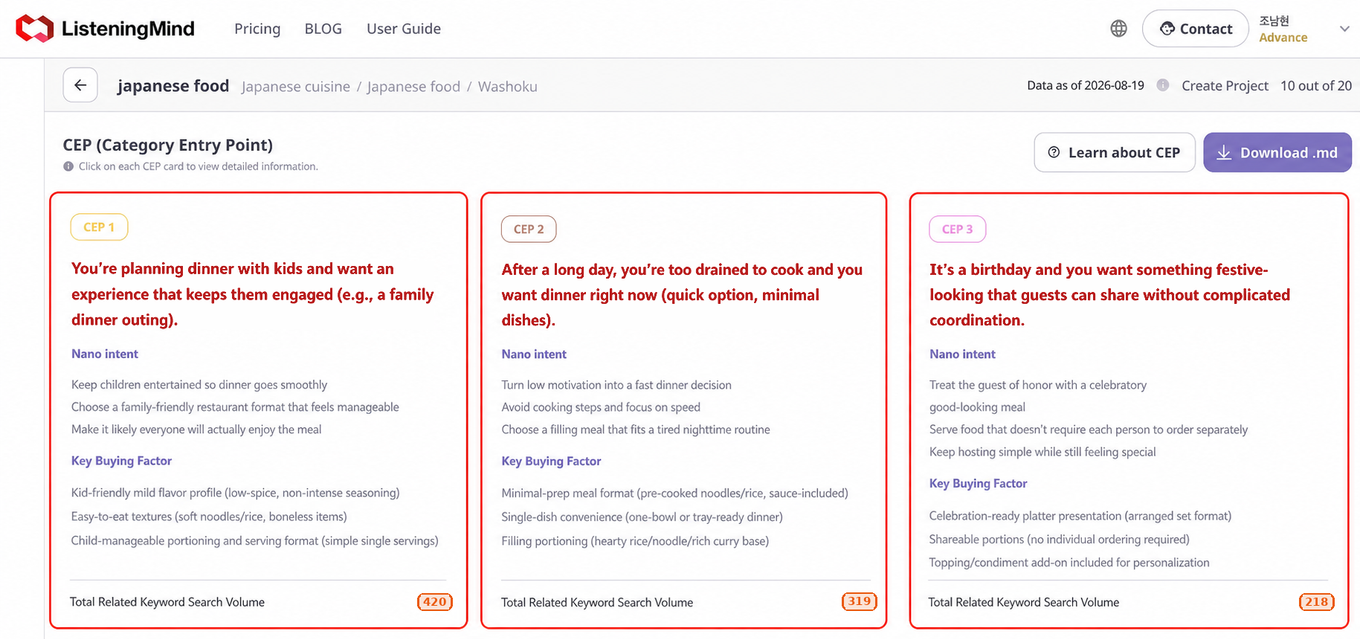
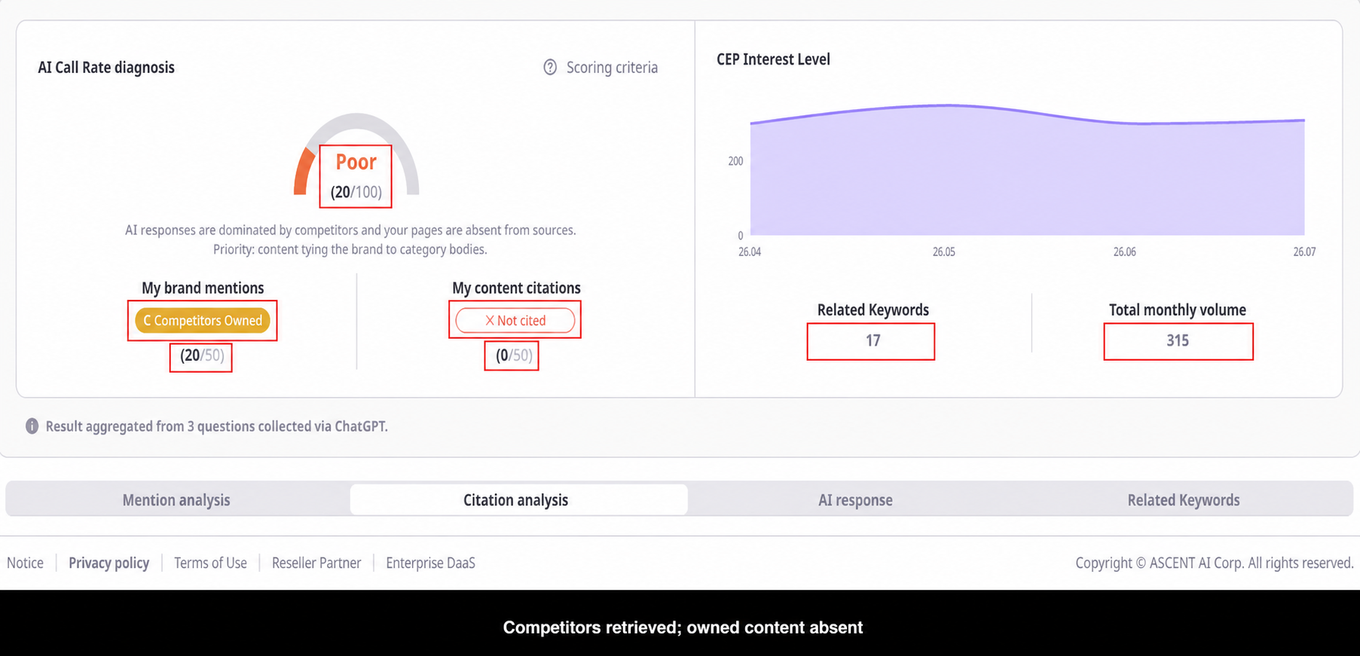
Data note: the CEP Finder card captures and the later AI Optimizer captures display slightly different related volume totals. For example, the Korean cultural CEP shows 562 in the CEP card and 550 in AI Optimizer, while the Japanese quick dinner CEP shows 319 and 315. We preserve the value shown in each product view and use the cards to compare entry point structure rather than treating the snapshots as one fixed measurement.
Cultural effect was discovered as a Korean entry context. It was not discovered as the leading Japanese entry pattern in this analysis.
Category Recognition, Brand Retrieval, and Citation Are Different Outcomes
Next, we moved from category entry points to AI retrieval. For this test, the marketer lens matters. A Korean food marketer may care about Nongshim, while a Japanese food marketer may care about Nissin. The question is not only whether AI knows those companies. It is whether a brand appears when a relevant occasion is described, and whether the AI response cites the brand’s own content.
For the Korean cultural CEP, AI Call Rate was Poor at 10 out of 100. The result stopped at category level, with no selected brand retrieval and no owned content citation. Likewise, for the Japanese quick dinner CEP, AI Call Rate was Poor at 20 out of 100. Competitors owned the response while the selected brand’s content was not cited.

However, a ramen level test adds an important correction. AI performance was not uniformly weak. For the night shift occasion, the ramen project returned Good at 50 out of 100. The selected brand was recommended, yet My content citations remained 0 out of 50. In other words, AI could retrieve the brand without using its owned pages as evidence.
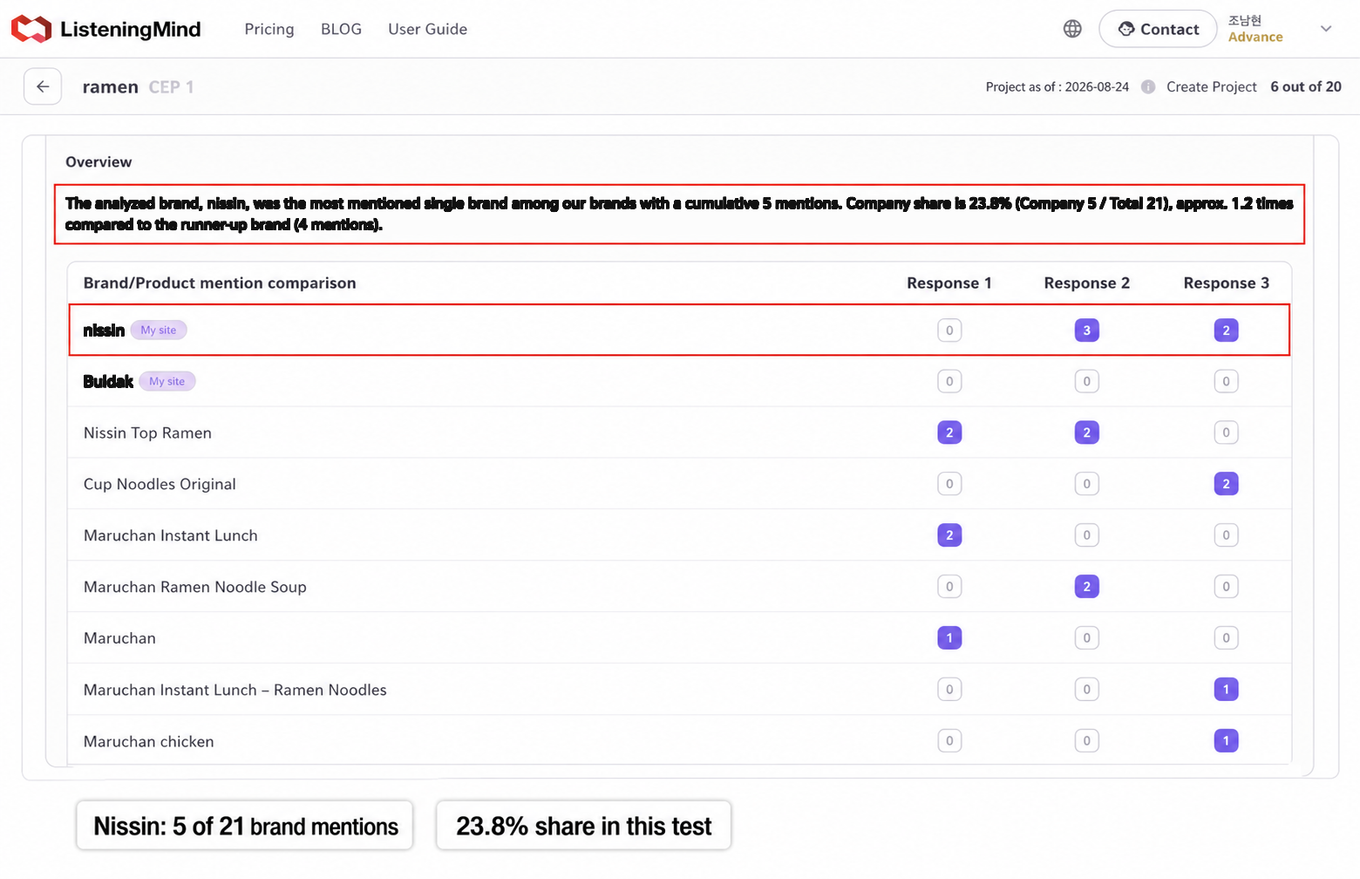
As a result, this distinction changes the marketer’s diagnosis. A competitor mention does not automatically mean AI has rejected your category position. The system may know the brand, retrieve it for some occasions, fail to retrieve it for others, and still lack a citable page from the brand itself.
AI knowing your brand is not the same as AI knowing when to recommend it, or why to cite you.
Verify That the Opportunity Has Real Search Demand
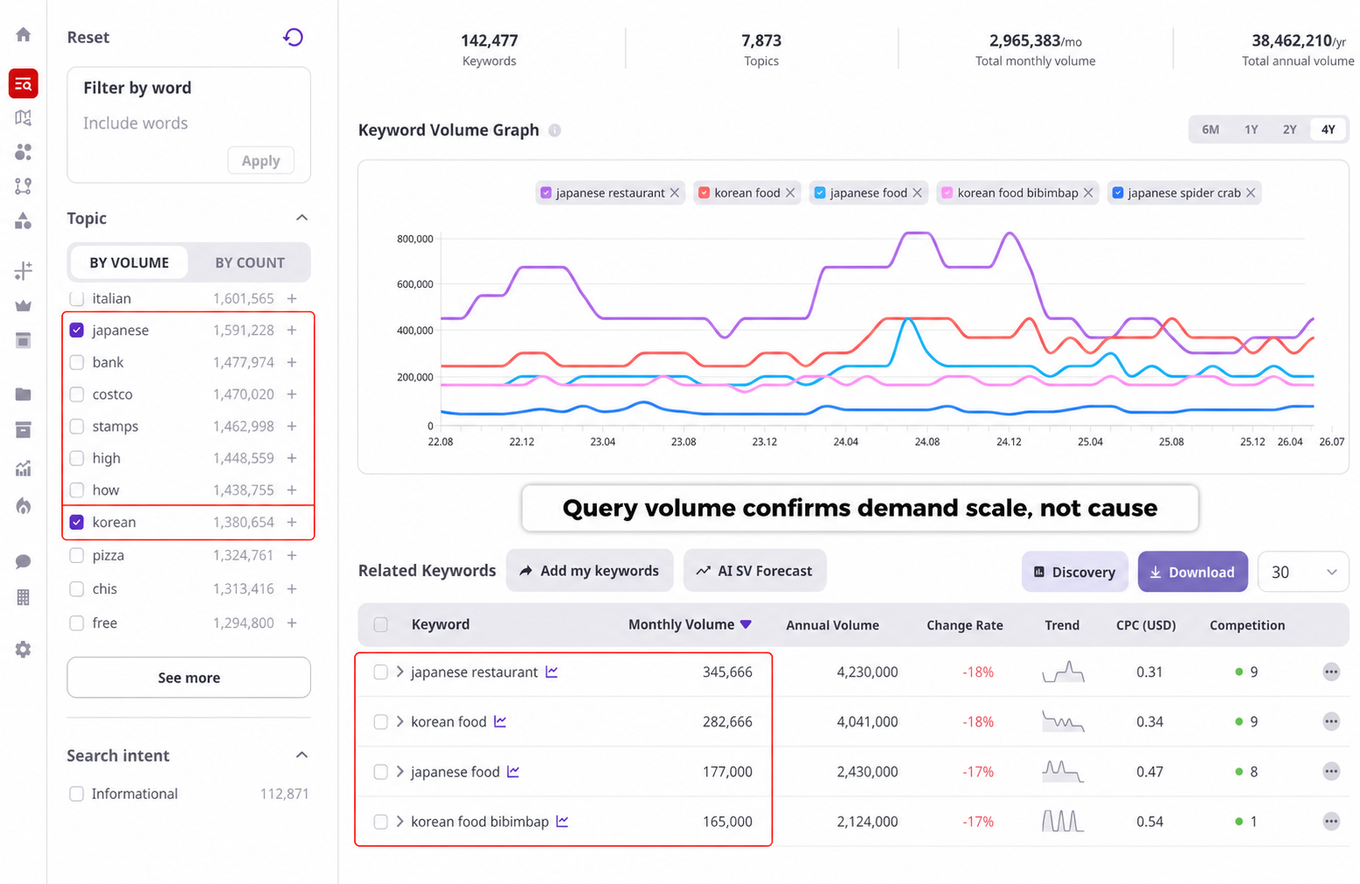
Finally, Query Finder checked whether the broader Korean and Japanese category language had meaningful volume. The visible representative queries included “japanese restaurant” at 345,666 monthly searches, “korean food” at 282,666, “japanese food” at 177,000, and “korean food bibimbap” at 165,000.
These volumes confirm that the surrounding demand is substantial. They do not explain why the searches occurred, and they do not prove that cultural exposure caused them. Query Finder provides scale. Journey Finder, CEP Finder, and AI Optimizer provide the behavioral and retrieval context needed to interpret that scale.
What Marketers Should Check Before Panicking About Competitor Mentions
- Journey: Does the cultural or behavioral signal appear in the search path, and how large is it beside category, location, and brand demand?
- CEP: Does that signal become a defined situation in which someone enters the category?
- AI retrieval: Does AI mention your brand, a competitor, or only the category for that situation?
- Citation: Does the answer rely on your owned content, or does another source explain the category for you?
- Query scale: Is the surrounding search demand large enough to justify content and distribution investment?
Our original hypothesis was partially visible, but not universal. Cultural effect appeared as a specific Korean entry context and as a smaller exploration layer in both journey datasets. It did not appear as the main intent behind total Korean or Japanese food demand, and the available data does not establish causality.
Ultimately, the stronger business conclusion is about retrieval. Competitor visibility becomes actionable when you can identify the occasion they own, the category language supporting it, and the evidence AI chooses to cite. The goal is not to force a brand into every answer. It is to become the most credible and citable brand for the moments that matter.

Hi, I’m Nam Hyun Cho, part of the Growth team at ListeningMind.
If this content made you curious about what your own category looks like, let’s just look at it together — 15 minutes, your data, no slides.