Index
Food culture is never shaped by a single tradition. Migration, regional communities, restaurant access, and changing tastes have brought cuisines from around the world into everyday American meals. The interesting question is not whether that diversity exists, but whether people express it in their own searches.
If we ranked that demand, what would come first: Chinese, Indian, Mexican, Thai, or something more specific than a country name?
A high search ranking can make a market story look convincing, but does it reflect real consumer demand or simply reinforce what a PR team wants to believe? To find out, we compare two Query Finder views. One ranks cuisine queries by country, while the other reveals what happens when consumers search by food type, including rice, noodles, salad, sandwich, meat, seafood, soup, and curry.
The result is more revealing than one Top 10 list. The cuisine ranking shows where broad attention sits. The food type ranking shows what that interest becomes when searchers name a dish, ingredient format, or preparation.
America’s Food Diversity Is Already Visible in Search
Ask someone to picture the American melting pot and they will probably reach for pizza, tacos, or maybe a burrito bowl. However, when we pulled every U.S. search that touched food, dish, or cuisine, the picture looked less American than expected and far more Asian than many marketers would guess.
If you recall the “What does 33% search Drop in Chinese Food Really Means?” episdoe, this is the same cuisine landscape we opened with then: the same Query Finder view, pulled from the same underlying dataset. There, we used it to follow one keyword through a year of change. This time, we are examining the full ranking at once.
The filtered landscape immediately showed a broad mix of cuisines, limited to those with more than 10,000 monthly searches. Chinese, Indian, Mexican, Thai, Mediterranean, Japanese, Korean, Vietnamese, Italian, and Greek searches all appeared near the top. Six of those 10 leading representative queries were Asian cuisines.
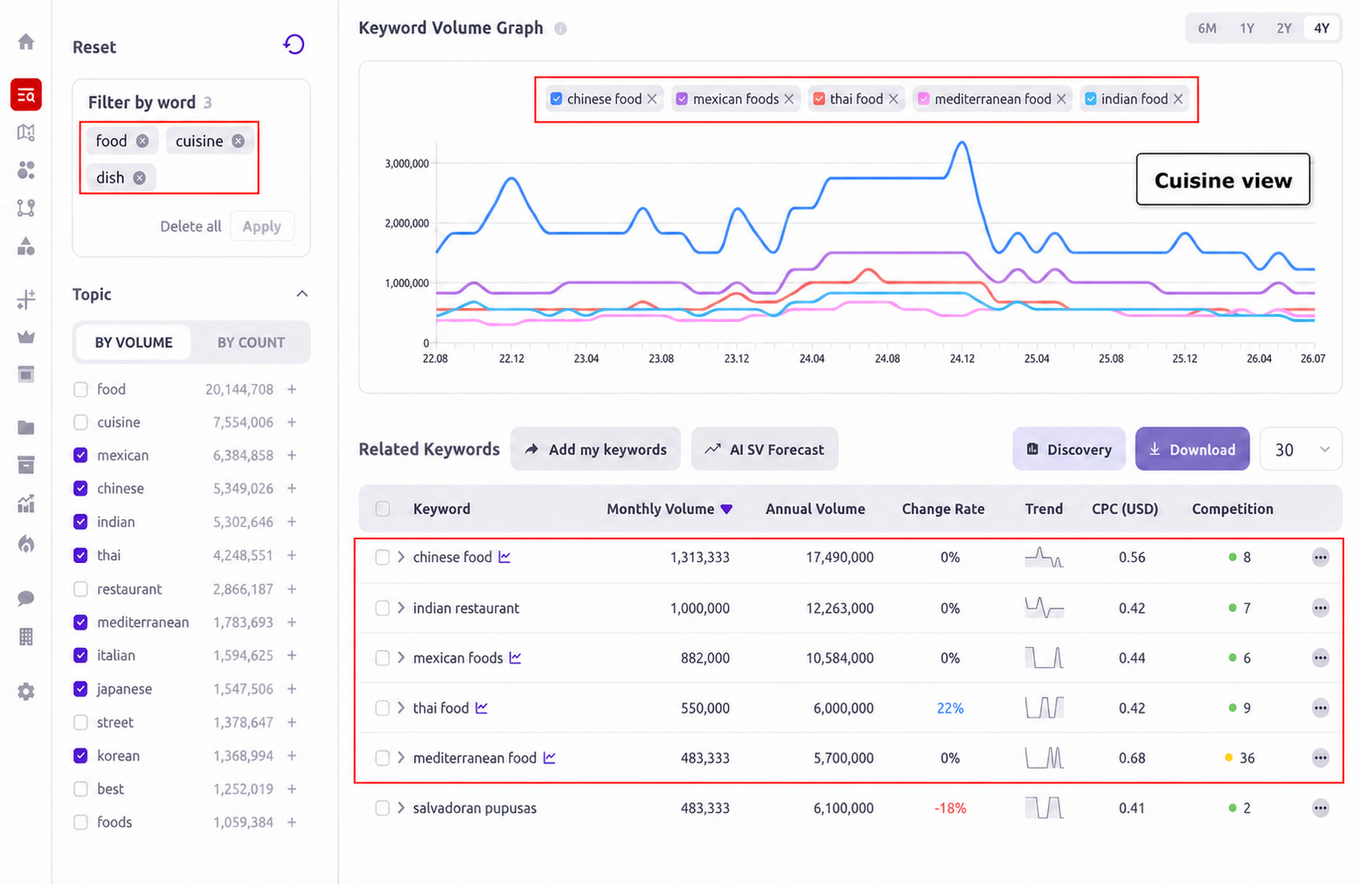
Therefore, the data supports a clear conclusion: international and Asian cuisines are not visible only in media narratives. They are present in consumer search behavior at meaningful scale.
However, the first ranking is still only a starting point. It mixes food, foods, and restaurant queries, and it compares one leading phrase from each cuisine. It shows the strongest representative language, not total market share.
The Ranking Is Already Three Different Searches
Chinese food leads the ranking at 1,313,333 monthly searches, followed by Indian restaurant at 1,000,000 and Mexican foods at 882,000. However, the wording of the list matters as much as the ranking.
| Rank | Representative query | Monthly volume |
| 1 | Chinese food | 1,313,333 |
| 2 | Indian restaurant | 1,000,000 |
| 3 | Mexican foods | 882,000 |
| 4 | Thai food | 550,000 |
| 5 | Mediterranean food | 483,333 |
| 6 | Japanese restaurant | 345,666 |
| 7 | Korean food | 282,666 |
| 8 | Vietnamese restaurant | 246,000 |
| 9 | Italian food | 157,000 |
| 10 | Greek food | 145,000 |
Some consumers search for a cuisine as food, while others frame the same need as a restaurant choice. As a result, the table compares the strongest visible expressions of demand, not identical consumer tasks.
Key point: Chinese food leads the broad query ranking, but the list is already mixing cuisine discovery with restaurant selection.
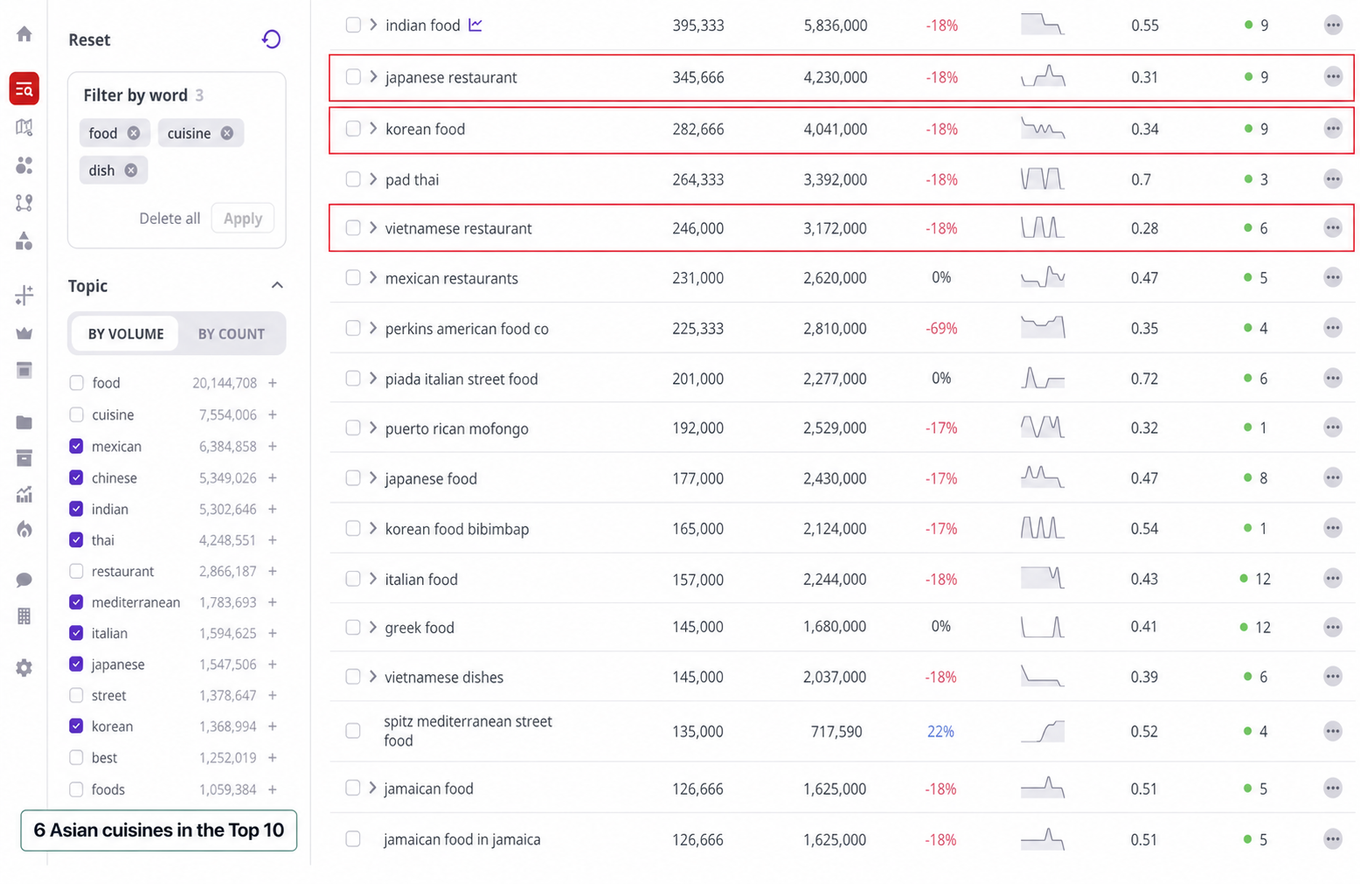
Moreover, the language itself gives us a clue. Chinese, Thai, Korean, Italian, and Greek lead with food. Indian, Japanese, and Vietnamese lead with restaurant. Mexican leads with foods. Therefore, instead of asking only which cuisine name is largest, we changed the filter and asked what happens when people search for foods and meal types they can picture eating.
Remove the Country Labels, and the Ranking Becomes a Menu
The second Query Finder view focused on eight food types: rice, noodles, salad, sandwich, meat, seafood, soup, and curry. The captured set contained 21,248 keywords and 634,771 in total monthly search volume. As a result, the top results no longer read like a list of national cuisines. They read like a menu.
| Rank | Food type query | Monthly volume |
| 1 | rice bowl Chinese | 45,666 |
| 2 | Indian curry recipe | 40,500 |
| 3 | Vietnamese banh mi | 38,566 |
| 4 | Thai curry | 31,100 |
| 5 | Thai larb | 31,100 |
| 6 | Chinese noodles | 29,100 |
| 7 | ramen in Japan | 27,466 |
| 8 | Korean rice cakes | 25,833 |
| 9 | Nigerian jollof rice recipe | 23,366 |
| 10 | Thai sticky rice | 22,466 |
Eight of the first 10 results still connect to Asian cuisines, but consumers now describe what they want through dishes and preparations such as rice bowls, banh mi, curry, ramen, and rice cakes. Nigerian jollof rice recipe becomes the first result outside that group at No. 9.
Key point: The first eight results connect to Asian cuisines, while the first result outside that group is Nigerian jollof rice recipe at No. 9.

This ranking is sorted by monthly volume, not change rate. That distinction matters because the next view sorts the same food types by how quickly they are moving.
However, this does not mean Asian food owns the entire U.S. market. Instead, it shows that broad cuisine interest remains visible when consumers move toward more specific food choices.
Change Rate Shows What Is Moving Now
Monthly volume shows which keywords are largest in the current landscape. Change rate answers a different question: Which keywords are reacting most quickly to current interest? Together, these metrics can reveal emerging topics, restaurant discovery, and changing recipe demand.
However, the largest percentage is not automatically the strongest trend. Several queries increased by 1,000%, but their current monthly volumes were only 10 or 26. Because small changes from a low starting point can produce dramatic percentages, these terms are better treated as early signals than evidence of demand at scale.
| Keyword | Monthly volume | Change rate | Signal type |
| Curry Hut Indian food | 1,600 | +400% | Specific restaurant discovery |
| Nigerian jollof rice recipe | 23,366 | +124% | Recipe and cooking interest |
| Korean rice dishes | 2,533 | +89% | Interest in a dish category |
| Curry naan Indian cuisine | 2,400 | +81% | Restaurant or menu discovery |
| Rice and Spice Thai cuisine | 1,020 | +80% | Specific restaurant discovery |
| Curry Indian food | 2,066 | +50% | Broader cuisine demand |
Nigerian jollof rice recipe provides a stronger signal. It combines 23,366 monthly searches with a 124% increase. By comparison, Curry Hut Indian food rose 400% but reached 1,600 monthly searches and appears to reflect a specific restaurant need. Therefore, both keywords are moving, but they represent different opportunities.
Key point: Change rate identifies movement, while monthly volume shows its scale. Meanwhile, query wording reveals whether the opportunity involves a broad food trend, a recipe need, or local restaurant discovery.

Restaurant and Recipe Growth Need Different Responses
Query wording also clarifies the type of demand. For example, Curry naan Indian cuisine menu rose 300%, authentic Indian kitchen reviews rose 271%, and Thai curry cuisine Denver rose 200%. These searches point toward menus, reviews, restaurants, or locations. Nigerian jollof rice recipe, on the other hand, describes a broader cooking need with a much larger active search base.
Although the reaction is real in both cases, the marketing response should differ. A restaurant query can inform local visibility, menu content, and review coverage. By contrast, a recipe query can support national content, ingredient information, and cooking guidance.
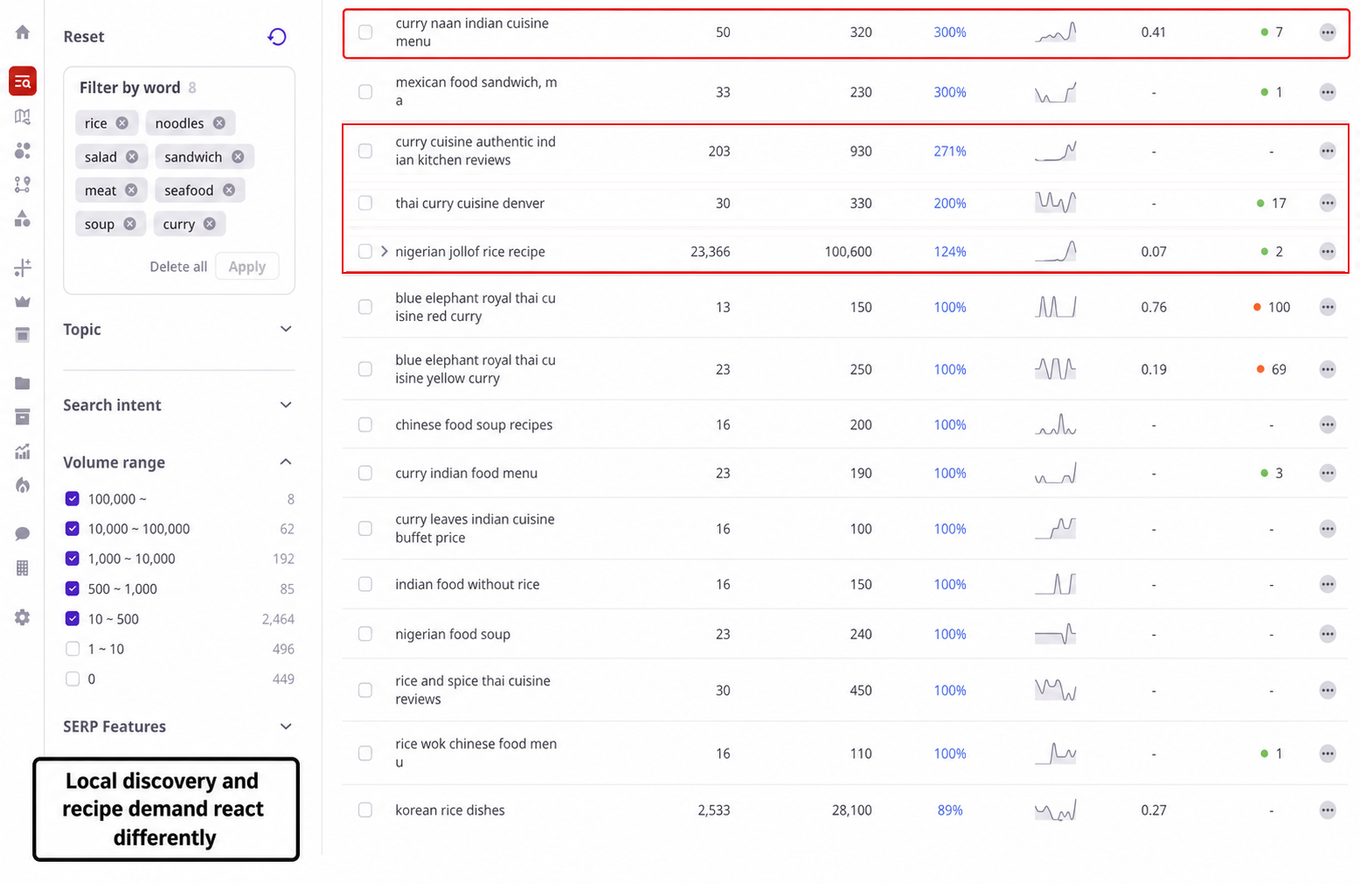
The change rate ranking mixes local discovery with broader recipe demand. Query wording separates the two.
Below the largest percentage jumps, several queries retain enough volume to give the movement more context. For instance, Korean rice dishes reached 2,533 monthly searches with an 89% increase. Curry naan Indian cuisine reached 2,400 with an 81% increase, while Rice and Spice Thai cuisine reached 1,020 with an 80% increase.
Chinese food noodles name also rose 80%, but its monthly volume was only 83. As a result, the same percentage represents demand that differs by several orders of magnitude.

Moderate Growth Can Still Carry Meaningful Demand
The 50% range reveals another mix of search needs. Curry Indian food recorded 2,066 monthly searches, while curry leaf Indian cuisine photos recorded 480. In addition, several results refer to menus, restaurant names, photos, sandwiches, or specific locations. Therefore, the same percentage can represent broad cuisine interest, visual research, or a local dining task.
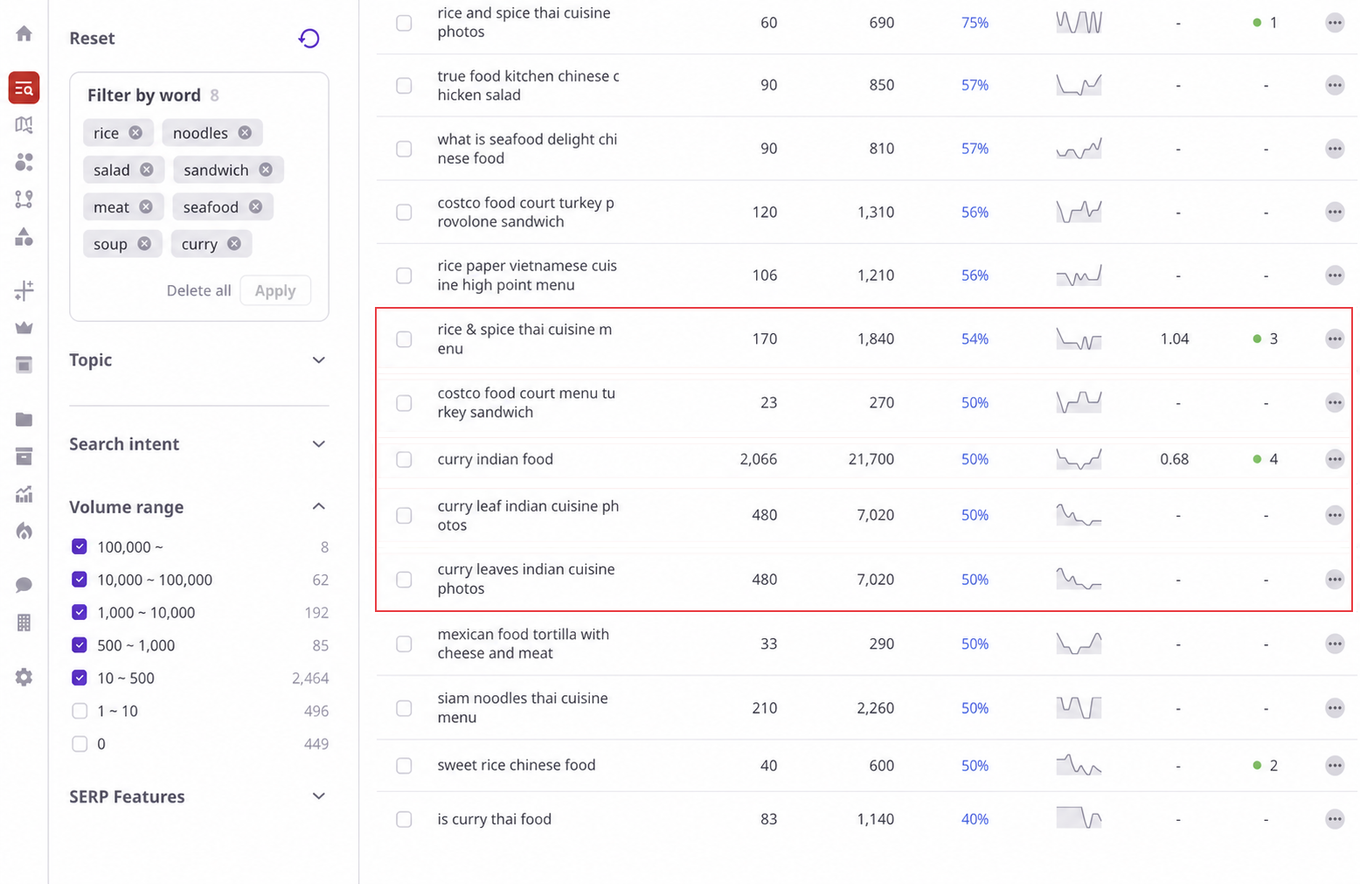
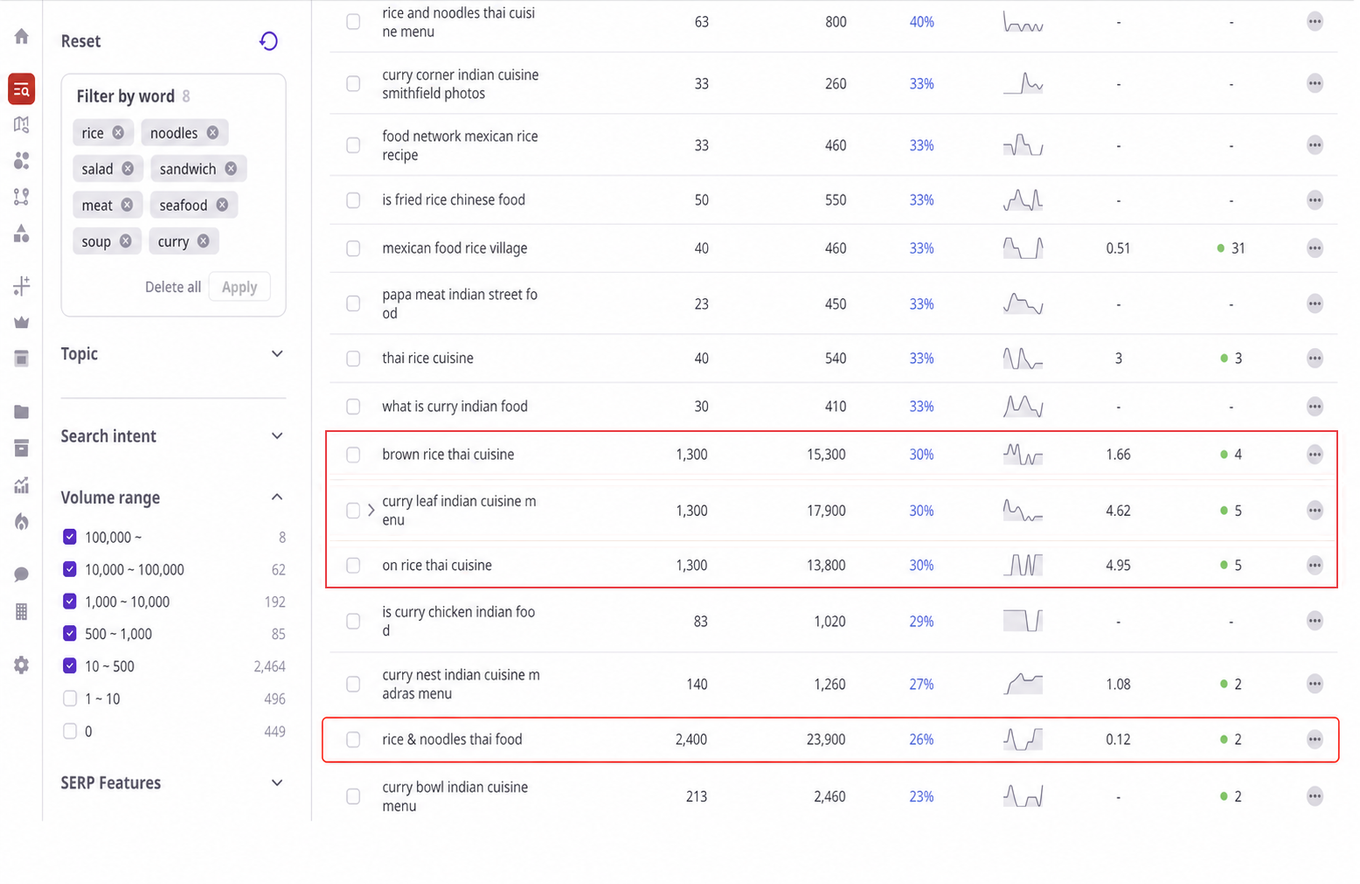
Finally, smaller increases can still matter when the current search volume is larger. Brown rice Thai cuisine, curry leaf Indian cuisine menu, and On Rice Thai cuisine each reached 1,300 monthly searches with 30% growth. Likewise, rice and noodles Thai food reached 2,400 with 26% growth.
Although these percentages appear modest beside 1,000%, they represent a much larger active search base than many of the fastest rising terms.
Key point: The most useful trend is not always the largest percentage. A smaller increase on a larger search base can offer a stronger and more durable content opportunity.
What Americans Search For Is More Specific Than a Cuisine Name
As a result, the food type results reveal several kinds of demand that the country ranking compresses into one label.
A meal they can recognize. Vietnamese banh mi, Thai larb, and Korean rice cakes name a specific food experience. These queries are closer to a concrete choice than Vietnamese restaurant, Thai food, or Korean food.
A familiar format across cultures. Rice, noodles, soup, salad, and curry connect different cuisines through familiar meal formats. Therefore, searchers can explore a new cuisine without starting from an unfamiliar category label.
A way to make the food. Indian curry recipe reached 40,500 monthly searches, while Nigerian jollof rice recipe reached 23,366. These searches indicate cooking and preparation needs, not only restaurant discovery.
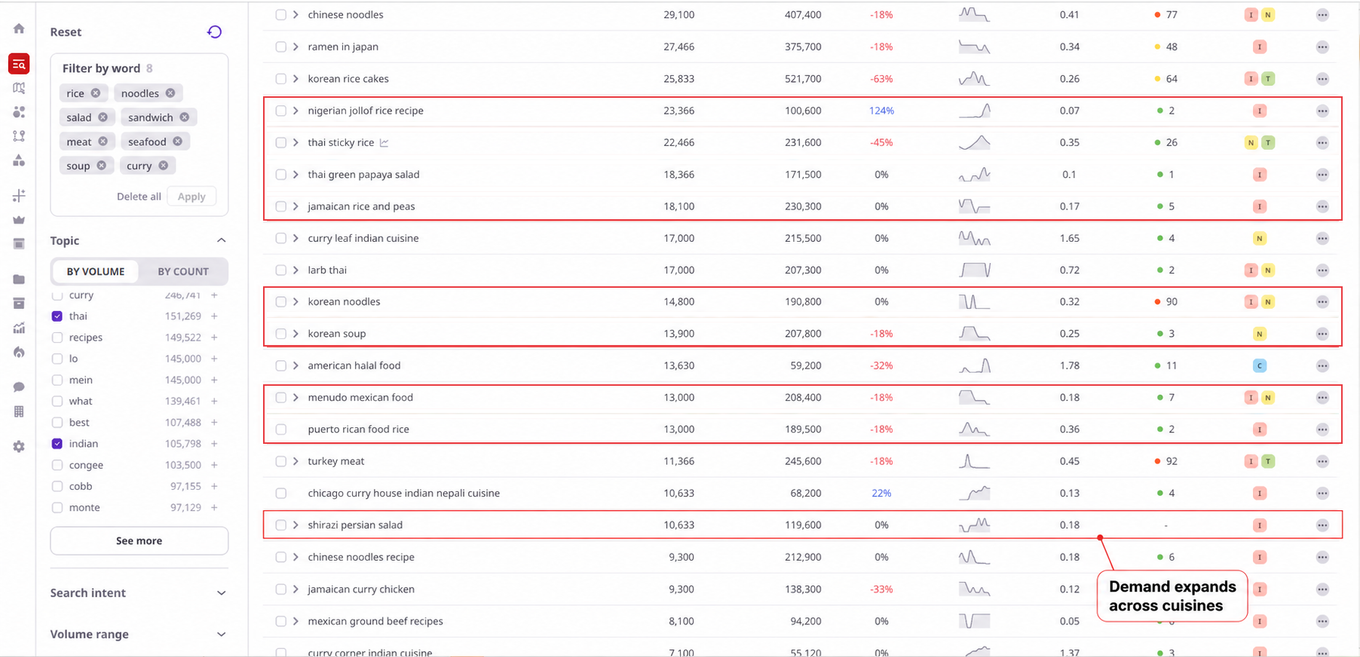
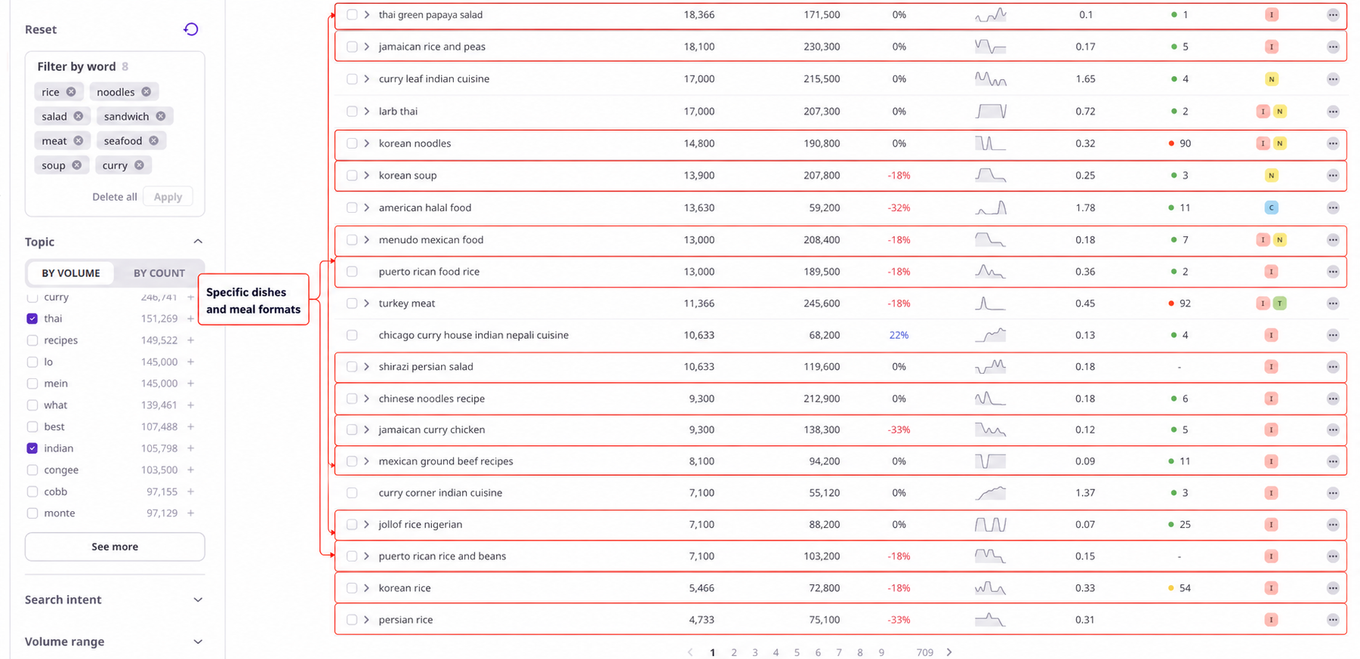
Moreover, this wider list reflects the diversity of U.S. food culture more clearly than the cuisine ranking alone. Nigerian jollof rice, Jamaican rice and peas, Mexican menudo, Puerto Rican rice, Persian salad, and Jamaican curry chicken appear alongside Asian dishes. This was never a contest between cultures. Instead, it was always a list of what people wanted to eat, described in the language they chose to use.
Asian Cuisine Demand Becomes More Detailed, Not Less Visible
Although the broad ranking placed six Asian cuisines in the Top 10, a second pattern appears below the table. Each cuisine fragments into multiple dish and preparation searches, but not by the same amount.
- Thai: 3 spots in the Top 10, plus Thai green papaya salad (18,366) and “larb Thai” (17,000). Five entry points total.
- Chinese: 2 spots in the Top 10, plus Chinese noodles recipe (9,300). Three entry points total.
- Korean: 1 spot in the Top 10, plus noodles (14,800), soup (13,900), and rice (5,466). Four entry points total.
- Indian: 1 spot in the Top 10, plus curry leaf Indian cuisine (17,000), before the list turns restaurant specific.
Therefore, four cuisines produce four different demand structures. Thai spreads across five visible entry points, while Chinese is more concentrated. Treating Asian food as one consumer task would miss those differences.
The Takeaway from Observing the Ranking
Ultimately, the cuisine view and the food type view ask two different questions. The center of demand moves with the question. Ask by cuisine, and Chinese food sits at the center of the broad ranking. Ask by food type, and that center shifts to rice bowls, curry recipes, banh mi, larb, noodles, ramen, rice cakes, and jollof rice.
Search volume is not sales or stated preference. However, it shows where people are looking and how quickly that center moves once we stop asking only for a country name.
For marketers, a country name marks where a ranking starts, not where the center of demand actually sits. Therefore, teams should examine the dishes, recipes, meal formats, and local searches underneath that label before treating it as the market. When a keyword spikes, they should also confirm the signal with current volume and query wording before calling it a real trend.
Six of the Top 10 U.S. cuisine searches are Asian. That much is real. The more useful finding is where the center moves once people stop searching only by country name and start describing what they actually want to eat. ListeningMind helps teams move past the ranking to the search intent driving their marketing strategies.

Hi, I’m Nam Hyun Cho, part of the Growth team at ListeningMind.
If this content made you curious about what your own category looks like, let’s just look at it together — 15 minutes, your data, no slides.